
AI Smoking Detection for Shared Mobility Fleets: From Alerts to Response
See how Streamax connects AI smoking detection, video evidence, vehicle-side sensing, and fleet workflows to verify violations and speed up response.


Subscribe now
Fare systems are useful, but they rarely tell the whole journey story. A tap-on record may show where someone boarded, while cash riders, transfers, alighting stops, and informal passenger movements can stay hidden. For a bus operator, that gap matters. It can make a busy route look manageable, a low-use stop look necessary, or a transfer corridor look weaker than it really is.
This is where automatic passenger counting becomes operational data, not just a reporting tool. The goal is to understand where demand starts, where it ends, and how it changes by route, time period, vehicle type, and operating condition.
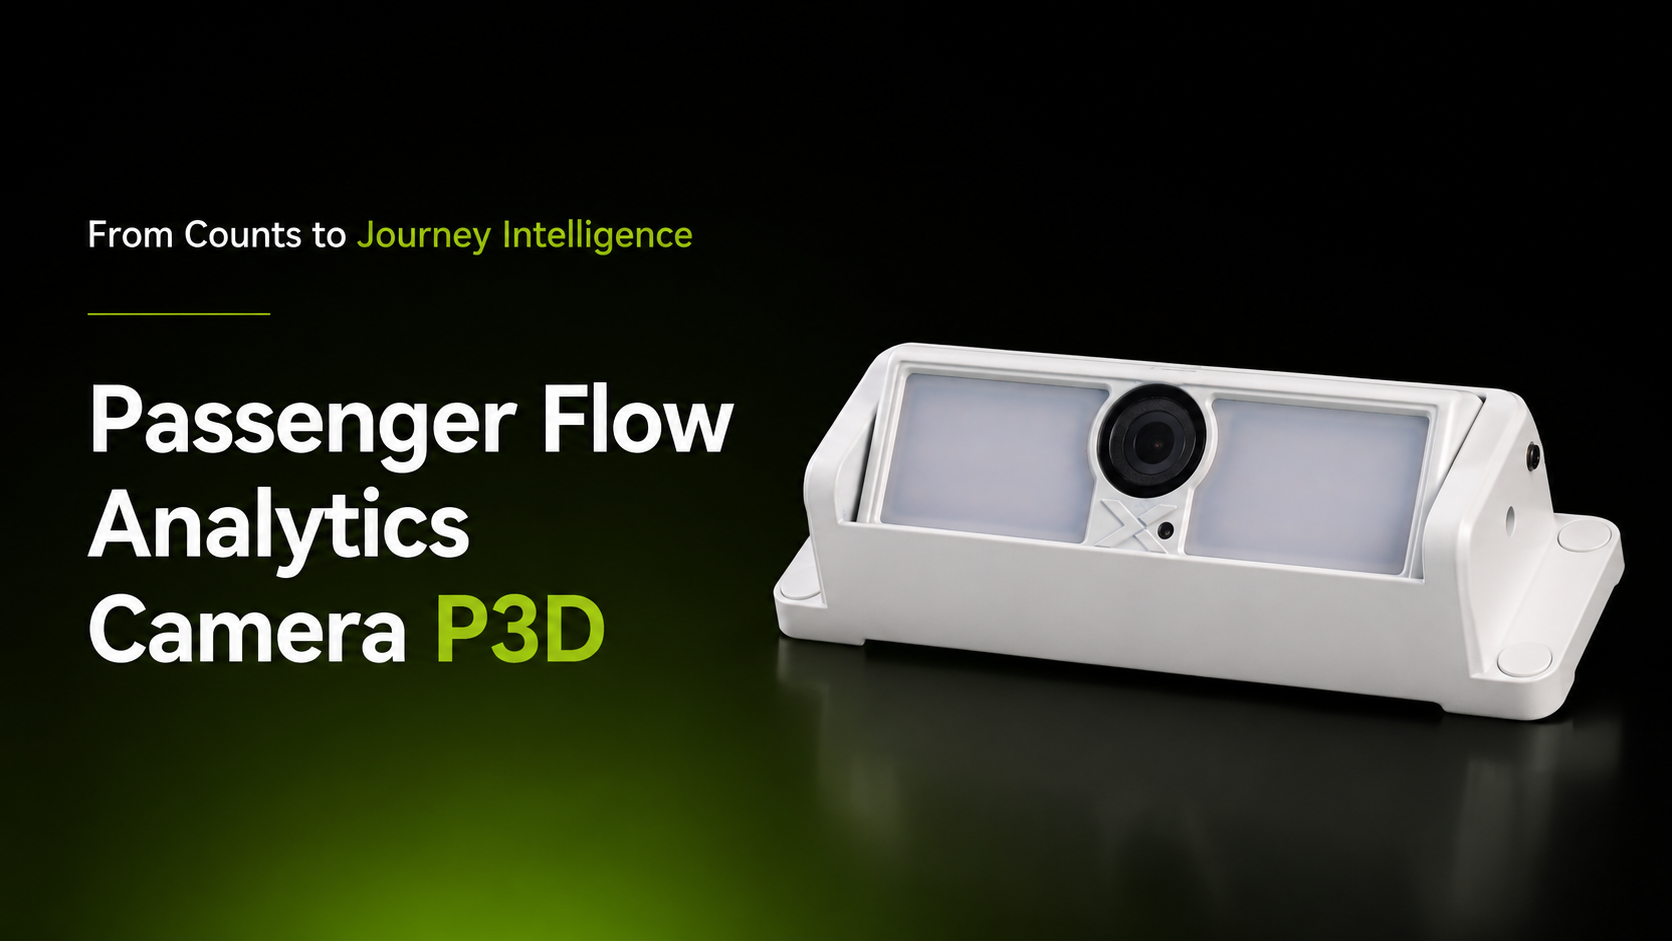
Streamax Passenger P3D is built for that door-level data problem. It automatically counts passengers boarding and alighting, distinguishes adults, children, and objects such as wheelchairs, prams, bicycles, and suitcases, then uploads passenger flow data to a cloud platform for analysis. For operators building a broader public transit solution, that gives planning teams a stronger base than fare data alone.
Bus networks are full of decisions that depend on passenger flow data. Which trips need larger vehicles? Which stops create transfers? Which routes are crowded in one direction but underused in the other?
When the data is incomplete, teams fall back on partial signals. Fare collection data can miss alighting points. Manual surveys are slow and expensive to repeat. Driver feedback is useful, but it is not consistent enough to support every scheduling decision. Even well-run agencies can end up planning around assumptions because the evidence arrives late or only covers part of the journey.
This also affects reporting. The U.S. Federal Transit Administration's National Transit Database organizes transit information around categories such as service data, expenses, monthly ridership, assets, fares, and safety. Passenger data connects to cost, service design, fleet use, and public accountability.
Passenger P3D focuses on the moment where the trip becomes measurable: the bus door. Its built-in deep learning algorithm recognizes passenger movement at boarding and alighting points, then separates direction and category so operators can see more than a single total.
P3D supports 1920x1080 resolution at 30fps, a 120 degree field of view, built-in white complementary light, wide dynamic imaging, and all-weather color mode. Those details matter because bus doors are not clean laboratory environments. P3D is designed for common boarding patterns, including crowded boarding and alighting, side-by-side movement, simultaneous boarding and alighting, and passengers carrying suitcases.
The system also supports matching passengers' starting and stopping points through non-biological features. In practical terms, that means the data can support origin-destination analysis without relying only on payment behavior. For operators, OD data helps reveal which passenger corridors are actually active, not just which stops collect fares.A simple counter answers one question: how many people crossed the door? OD intelligence answers a better one: how does demand move through the network?
A simple counter answers one question: how many people crossed the door? OD intelligence answers a better one: how does demand move through the network?
With boarding and alighting data connected to stops, routes, and trips, operators can compare load patterns across the day. A crowded route may only need targeted peak reinforcement. A quiet route may still matter if it connects two high-value transfer points.
This is why Streamax frames passenger flow and OD as part of public transit optimization. The Streamax Public Transit Solution describes OD data insights, multi-category passenger classification, data-driven network optimization, and open integration architecture. P3D provides the vehicle-side data layer that helps make those workflows possible.
The value becomes clearer when passenger flow connects with scheduling and operations platforms. Streamax's article on PT Cloud bus operational control shows the same direction from another angle: bus operations improve when scheduling, monitoring, and analytics work from the same operating picture.
For planning teams, P3D can support route and stop reviews. Instead of asking whether a line "feels" crowded, teams can compare actual boarding, alighting, and load trends by time period. That helps identify underused segments, overloaded corridors, and stops that matter more for alighting or transfers than for boarding.
For dispatch teams, passenger flow data can support faster adjustment during peak hours or demand surges. If a route repeatedly overloads at specific stops, the operator has a stronger reason to adjust frequency, change vehicle assignment, or review the timetable.
For integration teams, P3D is designed to fit into existing vehicle environments. It supports multiple mounting options, vibration-resistant structure, remote upgrading and parameterization, and cloud/API docking for passenger flow and OD data. It is also certified for E-mark, ROHS, CE-EMC, EN50155, REACH, ITxPT, and EN45545.
Streamax has already connected P3D analytics with route optimization in a public transit case. In the ACTC Lebanon transit modernization story, Streamax reports that P3D analytics helped ACTC identify underused stops, optimize routes, reduce selected trip duration from 40 minutes to 25 minutes, and increase daily ridership from 200 to about 7,000 passengers.
That case should not be read as a universal result for every bus network. But it does show the role passenger flow analytics can play when tied to dispatch, public information, and management decisions rather than left as a standalone counter.
Modern transit teams increasingly need data that can serve both internal operations and rider-facing systems. The GTFS Realtime reference includes vehicle position information and occupancy status fields, which shows how crowding and vehicle data can become part of the wider public transit information layer.
P3D does not need to replace every existing system. Its role is more specific: capture reliable door-level movement, classify passenger and object types, support OD matching, and make passenger flow data available for cloud analysis or API integration. That makes it easier for operators to connect vehicle evidence with planning, scheduling, fare review, and passenger information workflows.
Want to learn more about P3D or Streamax public transit solutions? Contact us for more details.
Does passenger flow data improve route planning automatically?
No. The data gives operators better evidence, but planning decisions still depend on service goals, budgets, road conditions, policy requirements, and passenger needs. P3D helps reduce blind spots so route changes can be based on actual movement patterns rather than assumptions alone.
What vehicle environments does P3D support?
P3D supports bus-related vehicle environments and multiple installation methods, including built-in mounting, suspended-ceiling mounting, and side mounting. It also supports a vibration-resistant structure and remote upgrades, with certifications such as E-mark, CE-EMC, EN50155, ITxPT, and EN45545.
Can Passenger P3D support fare verification?
Yes. Operators can compare passenger activity with fare records to investigate gaps, but the exact workflow depends on the local fare system and data integration.
How is P3D different from fare-card data?
Fare-card data usually starts from payment behavior. P3D starts from physical movement at the bus door. It can count boarding and alighting events, classify adults, children, wheelchairs, prams, bicycles, and suitcases, and support OD analysis even when payment data is incomplete.
What is passenger flow analytics in bus fleet management?
Passenger flow analytics uses boarding, alighting, load, and origin-destination data to understand how passengers move through a bus network. It helps operators plan routes, adjust frequency, review stop value, and compare actual demand against schedules or fare records.


Subscribe now

